2009年 4月 1日 掲載, 2009年 8月 5日 修正(双曲放物面の計算式)
前回,psxyコマンドでシンボルを敷きつめて, グラデーションのかかった分布図を作ってみたが, GMT にはちゃんとそれ用のコマンドがある. grdimageコマンドである.
grdimage の man を見てみると,
grdimage - Create grayshaded or colored image from a 2-D netCDF grid file
とある.2次元の netCDFグリッドファイルを用意する必要があるらしい.
単純な xyz のテキストファイルから, この「2次元の netCDFグリッドファイル」を作るためのコマンドに xyz2grdコマンドがある. まずは,これから見てみよう.
xyz2grd コマンドを単独で実行してみると,使い方がずらっと出力される.
xyz2grd 4.2.1 - Converting [xy]z data to a GMT grid file

usage: xyz2grd [<[xy]zfile(s)>] -G<grdfile> -I<xinc>[u][=|+][/<yinc>[u][=|+]] -R<west>/<east>/<south>/<north>[r]
	[-A[n|z|u|l]] [-D<xname>/<yname>/<zname>/<scale>/<offset>/<title>/<remark>] [E[<nodata>]] [-F] [-H[<nrec>]]
	[-N<nodata>] [-S[<zfile]] [-V] [-Z[<flags>]] [-:[i|o]] [-bi[s|S|d|D][<ncol>]] [-f[i|o]<colinfo>]
	xyzfile(s) is a 1- or 3-column file [or standard input] with [x,y,]z values
	-G to name the output grid file.
	-I<xinc>[m|c|e|k|i|n|+][=][/<yinc>[m|c|e|k|i|n|+][=]]
	   Give increment and append unit (m)inute, se(c)ond, m(e)ter, (k)ilometer, m(i)les, (n)autical miles.
	   (Note: m,c,e,k,i,n only apply to geographic regions specified in degrees)
	   Append = to adjust the domain to fit the increment [Default adjusts increment to fit domain].
	   Alternatively, specify number of nodes by appending +. Then, the increments are calculated
	   from the given domain and grid-registration settings (see Appendix B for details).
	-R specifies the min/max coordinates of data region in user units.
	   Use dd:mm[:ss] format for regions given in degrees and minutes [and seconds].
	   Use [yyy[-mm[-dd]]]T[hh[:mm[:ss[.xxx]]]] format for time axes.
	   Append r if -R specifies the longitudes/latitudes of the lower left
	   and upper right corners of a rectangular area.
	   -Rg -Rd are accepted shorthands for -R0/360/-90/90 -R-180/180/-90/90

	OPTIONS:
        :
        :
最低限 4つの値を指定する必要があるらしい.
さっそく,前回使った双曲放物面のデータ hp.txt を grdfile に変換してみよう.
$ awk 'BEGIN{for(x=-4;x<=4;x+=0.4)for(y=-4;y<=4;y+=0.4)print x, y, x^2-y^2}' >  hp.txt
$ xyz2grd hp.txt -Ghp.grd -I0.4 -R-4/4/-4/4
-I には,hp.txt を作るときに awk で指定した increment の値 0.4 を指定し, -R には,同じく xy の範囲 -4 〜 4 を指定しておいた.
できあがった hp.grd の中身を見てみよう. バイナリファイルなので,less などのテキストビュアで直接見ることはできない. netCDFファイルなので,ncdumpコマンドで CDL に変換して見てみる.
$ ncdump hp.grd
netcdf hp {
dimensions:
	x = 21 ;
	y = 21 ;
variables:
	float x(x) ;
		x:long_name = "x" ;
		x:actual_range = -4., 4. ;
	float y(y) ;
		y:long_name = "y" ;
		y:actual_range = -4., 4. ;
	float z(y, x) ;
		z:long_name = "z" ;
		z:_FillValue = nanf ;
		z:actual_range = -16., 16. ;
		z:coordinates = "x y" ;

// global attributes:
		:Conventions = "COARDS, CF-1.0" ;
		:title = "hp.grd" ;
		:history = "xyz2grd -R-4/4/-4/4 -I0.4 hp.txt -Ghp.grd" ;
		:GMT_version = "4.2.1" ;
		:node_offset = 0 ;
data:

 x = -4, -3.6, -3.2, -2.8, -2.4, -2, -1.6, -1.2, -0.8, -0.4, 0, 0.4, 0.8,
    1.2, 1.6, 2, 2.4, 2.8, 3.2, 3.6, 4 ;

 y = -4, -3.6, -3.2, -2.8, -2.4, -2, -1.6, -1.2, -0.8, -0.4, 0, 0.4, 0.8,
    1.2, 1.6, 2, 2.4, 2.8, 3.2, 3.6, 4 ;

 z =
  0, -3.04, -5.76, -8.16, -10.24, -12, -13.44, -14.56, -15.36, -15.84, -16,
    -15.84, -15.36, -14.56, -13.44, -12, -10.24, -8.16, -5.76, -3.04,
    -7.10543e-15,
  3.04, 0, -2.72, -5.12, -7.2, -8.96, -10.4, -11.52, -12.32, -12.8, -12.96,
    -12.8, -12.32, -11.52, -10.4, -8.96, -7.2, -5.12, -2.72, -7.10543e-15,
    3.04,
  :
  :
  :
  7.10543e-15, -3.04, -5.76, -8.16, -10.24, -12, -13.44, -14.56, -15.36,
    -15.84, -16, -15.84, -15.36, -14.56, -13.44, -12, -10.24, -8.16, -5.76,
    -3.04, 0 ;
}
x座標の値,y座標の値,および各座標の値 z が格納されている.
さて,これを図化するのだが,grdimageコマンドの usage も見ておこう. grdimageコマンドを単独で実行する.
$ grdimage
grdimage 4.2.1 - Plot grid files in 2-D

usage: grdimage <grd_z|grd_r grd_g grd_b> -J<params> [-B<params>] [-C<cpt_file>] [-Ei|<dpi>] [-G[f|b]<rgb>]
	[-I<intensity_file>] [-K] [-M] [-O] [-P] [-Q] [-R<west>/<east>/<south>/<north>[r]] [-S[-]b|c|l|n[/<threshold>]] [-T]
	[-U[/<dx>/<dy>][<label>]] [-V] [-X[a|c|r]<x_shift>[u]] [-Y[a|c|r]<x_shift>[u]] [-c<ncopies>]

	<grd_z> is data set to be plotted.  Its z-values are in user units and will be
	  converted to rgb colors via the cpt file.  Alternatively, give three separate
	  grid files that contain the red, green, and blue components in the 0-255 range.
	-J Selects map proJection. (<scale> in cm/degree, <width> in cm)
	   Append h for map height, + for max map dimension, and - for min map dimension.
	   Azimuthal projections set -Rg unless polar aspect or -R<...>r is given.

        :
        :
grdfile の grd_z または,grd_r, grd_g, grd_b の 3つのファイルと, 図法の -Jオプションが最低限必要なようである. では,さっそく,
$ grdimage hp.grd -Jx1
grdimage: GMT SYNTAX ERROR:  Must specify color palette table
カラーパレットファイルが必要といわれる. あ,usage にちゃんと書いてあったか. 前回使った cp2.cpt を -Cオプションで指定しよう.
$ echo -16 0 0 255 0 255 255 255 > cp2.cpt
$ echo 0 255 255 255 16 255 0 0 >> cp2.cpt
$ grdimage hp.grd -Jx1 -Ccp2.cpt > hp.eps

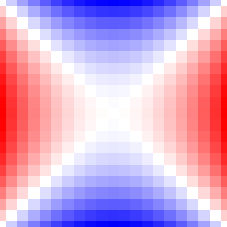
前回と同じ図が描けた. できた図は同じだが,今回のやり方が本来の描画方法である. 前回のやり方では,-Jオプションで縮尺を変えると, いちいちシンボルのサイズを変えなくてはならないが, grdimageコマンドを使う今回のやり方では,その必要もない.
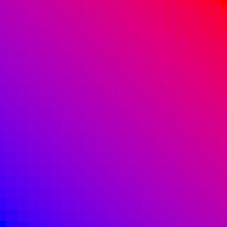
usage には,grd_z と cpt file(カラーパレットファイル)を与えるやり方の他に, RGB の 3色を grd_r, grd_g, grd_b の 3つのファイルで与えるやり方も書いてあった. ちょっと試してみよう. red と blue を 0〜255 の範囲で逆向きに変化させて重ね合わせてみる. 長くなるのでシェルスクリプトを書こう.
#!/bin/sh

awk 'BEGIN{for(x=-4;x<=4;x+=0.4)for(y=-4;y<=4;y+=0.4)print x, y, int(sqrt(x+y+8)*63.8)}' >  red.txt
awk 'BEGIN{for(x=-4;x<=4;x+=0.4)for(y=-4;y<=4;y+=0.4)print x, y, 0}' >  green.txt
awk 'BEGIN{for(x=-4;x<=4;x+=0.4)for(y=-4;y<=4;y+=0.4)print x, y, int(sqrt(8-x-y)*63.8)}' >  blue.txt

xyz2grd red.txt   -Gred.grd   -I0.4 -R-4/4/-4/4
xyz2grd green.txt -Ggreen.grd -I0.4 -R-4/4/-4/4
xyz2grd blue.txt  -Gblue.grd  -I0.4 -R-4/4/-4/4

grdimage red.grd green.grd blue.grd -Jx1 > rgb.eps

[ KDOホームにもどる ] [ いちからはじめる GMT インデックスにもどる ]
(C) 2009 KDO