2009年 8月 1日 掲載, 2009年 8月 5日 修正(BFN の説明を修正)
今回と次回の 2回は,いろいろなカラーパレットファイルをためしてみる.
これまでに作ったグラデーション図は, 正の値が赤,負の値が青,という単純なものだったが, 地形図などは,ちゃんと地図っぽい色彩で描きたい. が,茶,黄,緑,青,紺, などの色を配したカラーパレットを自分で用意するのは, ちょっとめんどうだ. ということで,今回は出来合いのカラーパレットを出力してくれる makecpt というコマンドを紹介する.
さっそく makecptコマンドを単独で実行し,usage を見てみよう.
$ makecpt
makecpt 4.2.1 - Make GMT color palette tables

usage:  makecpt [-C<table>] [-D] [-I] [-M] [-N] [-Q[i|o]] [-T<z0/z1/dz> | -T<file>] [-V] [-Z]

	OPTIONS:
	-C Specify a colortable [Default is rainbow]:
	   [Default min/max values for -T are given in brackets]
	   ---------------------------------
	   cool      : Linear change from blue to magenta [0/1]
	   copper    : Dark to light copper brown [0/1]
	   cyclic    : Cyclic colormap, spans 360 degrees of hue [0/360]
	   gebco     : Colors for GEBCO bathymetric charts [-7000/0]
	   globe     : Colors for global bathy-topo relief [-10000/10000]
	   drywet    : Goes from dry to wet colors [0/12]
	   gray      : Grayramp from black to white [0/1]
	   haxby     : Bill Haxby's colortable for geoid & gravity [0/32]
	   hot       : Black through red and yellow to white [0/1]
	   jet       : Dark to light blue, white, yellow and red [0/1]
	   no_green  : For those who hate green [-32/+32]
	   ocean     : white-green-blue bathymetry scale [-8000/0]
	   panoply   : Default colormap of Panoply [0/16]
	   polar     : Blue via white to red [-1/+1]
	   rainbow   : Rainbow colors: magenta-blue-cyan-green-yellow-red [0/300]
	   red2green : Polar scale from red to green via white [-1/+1]
	   relief    : Wessel/Martinez colortable for bathymetry/topography [-8000/+8000]
	   topo      : Sandwell-Anderson colors for topography [-7000/+7000]
	   sealand   : Smith bathymetry/topography scale [-6000/+3000]
	   seis      : R-O-Y-G-B seismic tomography colors [-1/+1]
	   split     : Polar scale like polar, but via black instead of white [-1/+1]
	   wysiwyg   : 20 RGB colors for openwin -cubesize large and waxenvy printer [0/20]
	   ---------------------------------
           :
           :
           :
22種類のカラーパレットが用意されているようだ. これらの中から今回は,地形図のカラーパレットをためしてみることにする. 地形図関係で一番最初に挙がっている gebco を見てみよう. -Cオプションで gebco を指定する.
$ makecpt -Cgebco
#	cpt file created by: makecpt -Cgebco
#COLOR_MODEL = RGB
#
-7000	0	240	255	-6000	0	240	255
-6000	35	255	255	-5000	35	255	255
-5000	90	255	255	-4000	90	255	255
-4000	140	255	230	-3000	140	255	230
-3000	165	255	215	-2000	165	255	215
-2000	195	255	215	-1000	195	255	215
-1000	210	255	215	-500	210	255	215
-500	230	255	240	-200	230	255	240
-200	235	255	255	-0	235	255	255
B	0	0	0
F	255	255	255
N	128	128	128
-7000 から -0 までの配色がずらっと出力される. さらに B,F,N という色指定もある. これらは,
の色指定である. 上の gebco のカラーパレットを使うと, 値がパレット下限値の -7000 より小さいグリッドはバックグラウンドの黒(0/0/0), 値がパレット上限値の 0 より大きいグリッドはフォアグラウンドの白(255/255/255), 値がないグリッドは NAN のグレー(128/128/128)で描画される.
地形図の描画に使うため,出力されるカラーパレットをファイルに保存しておこう.
$ makecpt -Cgebco > gebco.cpt
makecpt: GMT Fatal Error: CPT file gebco.cpt has no z-slices!
あれ?エラーが出てしまった. gebco.cpt はできているが,中身は空っぽである. これは,-Cオプションでカラーパレットを指定すると, 最初にカレントディレクトリにその名前の cptファイルがないか探すために, こうなってしまうのである. 上のコマンドを実行すると,makecpt が実行される前に, シェルのリダイレクトで空の gebco.cpt が作られ, それを makecpt がみつけて使おうとして「空だ」とエラーを吐くのである. これをさけるためには,出力ファイル名を変えなくてはならない (今回は,空の gebco.cpt の削除もしておかなくてはならない).
$ rm gebco.cpt
$ makecpt -Cgebco > gbc.cpt
こうして作ったカラーパレットファイル gbc.cpt を使って地形図を描画してみる.
地形のデータは awk で作る. 試行錯誤して作ったのが,以下のシェルスクリプトである.
#!/bin/sh

awk 'BEGIN{for(x=-200; x<=200; x+=5)for(y=-200; y<=200; y+=5){
             mountain=2800*exp(-((x+80)*(x+80)+(y-80)*(y-80))/4000);
             z=(y-x+50)/20;
             coast=500*(exp(z)-exp(-z))/(exp(z)+exp(-z))-400;
             z=(y-x+250)/80;
             trench=-4800*exp(-z*z);
             print x, y,mountain+coast+trench+rand()*80-40} }' > geo.txt
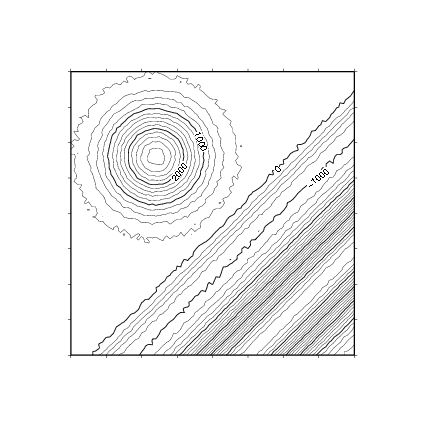
400km四方のエリアに,高さ 2900m の山,深さ 5700m の海溝を配した.
コンター図を描いてみる.
$ xyz2grd geo.txt -Ggeo.grd -I5 -R-200/200/-200/200
$ grdcontour geo.grd -C200 -A1000 -Jx0.025 -Bf50 > geo_cnt.eps

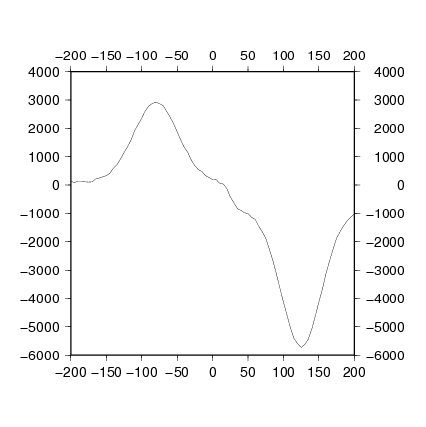
断面図は以下のようになる.
$ awk '{if($1 == -$2) print $1, $3}' geo.txt | sort -n > profile.txt
$ psxy profile.txt -R-200/200/-6000/4000 -Jx0.025/0.001 -Ba50/a1000 > profile.eps
この地形に gebco の色を塗る.
$ grdimage geo.grd -Jx0.025 -Cgbc.cpt -Bf50 -K > geo_gbc.eps
$ grdcontour geo.grd -C200 -A1000 -J -O >> geo_gbc.eps
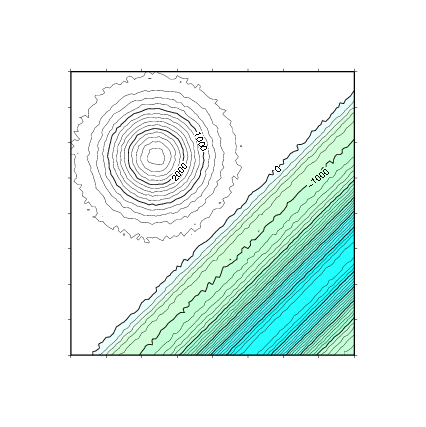
南東半分の海域が,うすい緑からうすい青の美しい段彩で描画された.
GEBCO は General Bathymetric Chart of the Oceans の略で, 海域しか色の指定がないので,陸域は白(フォアグラウンド F の色)である.
gebco の次に載っている globe が,陸域もあつかったカラーパレットである. gebco のときと同じようにカラーパレットファイルを作り,描画する.
$ makecpt -Cglobe > glb.cpt
$ grdimage geo.grd -Jx0.025 -Cglb.cpt -Bf50 -K > geo_glb.eps
$ grdcontour geo.grd -C200 -A1000 -J -O >> geo_glb.eps
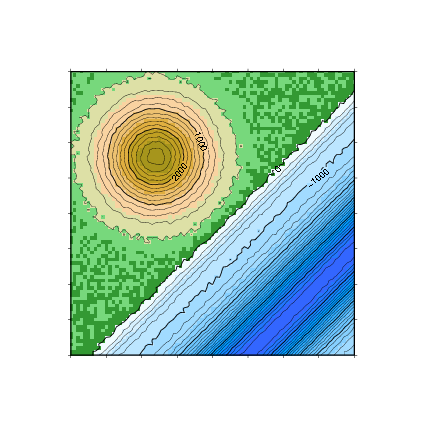
陸がグリーンと茶色になった.
この調子でどんどん描いていこう.
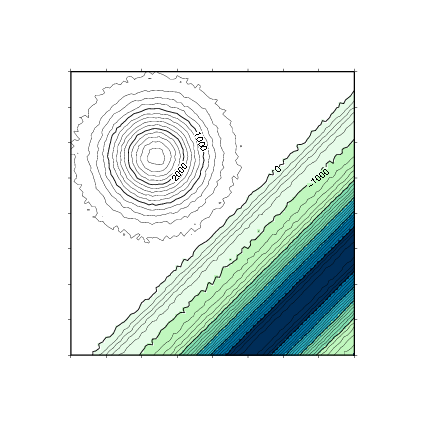
ocean:
$ makecpt -Cocean > ocn.cpt
$ grdimage geo.grd -Jx0.025 -Cocn.cpt -Bf50 -K > geo_ocn.eps
$ grdcontour geo.grd -C200 -A1000 -J -O >> geo_ocn.eps
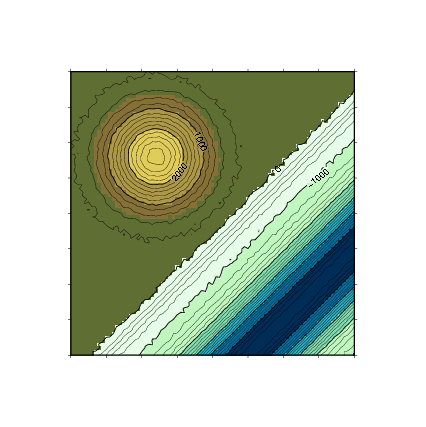
Wessel/Martinez の relief:
$ makecpt -Crelief > rlf.cpt
$ grdimage geo.grd -Jx0.025 -Crlf.cpt -Bf50 -K > geo_rlf.eps
$ grdcontour geo.grd -C200 -A1000 -J -O >> geo_rlf.eps
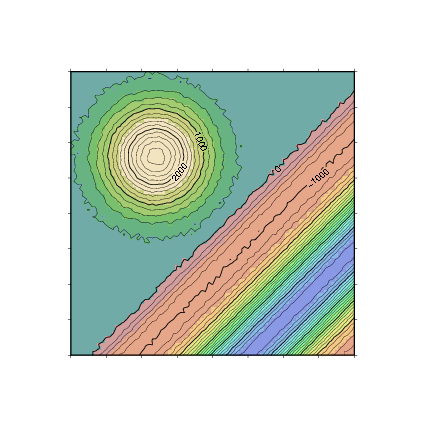
Sandwell-Anderson の topo:
$ makecpt -Ctopo > tp.cpt
$ grdimage geo.grd -Jx0.025 -Ctp.cpt -Bf50 -K > geo_tp.eps
$ grdcontour geo.grd -C200 -A1000 -J -O >> geo_tp.eps
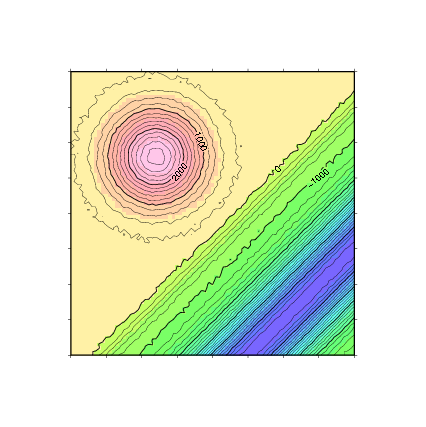
Smith の sealand:
$ makecpt -Csealand > sl.cpt
$ grdimage geo.grd -Jx0.025 -Csl.cpt -Bf50 -K > geo_sl.eps
$ grdcontour geo.grd -C200 -A1000 -J -O >> geo_sl.eps
以上の 6つが,makecpt にある地形図用のカラーパレットである.
次回は,地形図以外のカラーパレットをあつかってみる.
[ KDOホームにもどる ] [ いちからはじめる GMT インデックスにもどる ]
(C) 2009 KDO