2009年 6月 1日 掲載
先月は,だまって休載してしまい,申しわけない.
今回は,前回作った grdファイルを使ったコンター図の作成について,さらっと書いてみる.
GMT には,2次元の netCDFグリッドファイルをあつかう grd何とか,というコマンドがたくさんある.
$ ls /usr/local/GMT4.2.1/bin/grd*
/usr/local/GMT4.2.1/bin/grd2cpt         /usr/local/GMT4.2.1/bin/grd2xyz
/usr/local/GMT4.2.1/bin/grdblend        /usr/local/GMT4.2.1/bin/grdclip
/usr/local/GMT4.2.1/bin/grdcontour      /usr/local/GMT4.2.1/bin/grdcut
/usr/local/GMT4.2.1/bin/grdedit         /usr/local/GMT4.2.1/bin/grdfft
/usr/local/GMT4.2.1/bin/grdfilter       /usr/local/GMT4.2.1/bin/grdgradient
/usr/local/GMT4.2.1/bin/grdhisteq       /usr/local/GMT4.2.1/bin/grdimage
/usr/local/GMT4.2.1/bin/grdinfo         /usr/local/GMT4.2.1/bin/grdlandmask
/usr/local/GMT4.2.1/bin/grdmask         /usr/local/GMT4.2.1/bin/grdmath
/usr/local/GMT4.2.1/bin/grdpaste        /usr/local/GMT4.2.1/bin/grdproject
/usr/local/GMT4.2.1/bin/grdraster       /usr/local/GMT4.2.1/bin/grdreformat
/usr/local/GMT4.2.1/bin/grdrotater      /usr/local/GMT4.2.1/bin/grdsample
/usr/local/GMT4.2.1/bin/grdtrack        /usr/local/GMT4.2.1/bin/grdtrend
/usr/local/GMT4.2.1/bin/grdvector       /usr/local/GMT4.2.1/bin/grdview
/usr/local/GMT4.2.1/bin/grdvolume
全部で 23個もある.今回は,この中から grdcontour を試してみる.
grdcontour は,その名のとおり,grdファイルからコンター(contour,等高線)図を描くコマンドである. まずは,例によって単独で起動し,usage を見てみる.
$ grdcontour
grdcontour 4.2.1 - Contouring of 2-D gridded data sets

usage: grdcontour <grdfile> -C<cont_int> -J<params>
	[-A[-|<annot_int>][<labelinfo>] [-B<params>] [-D<dumpfile>] [-Eazimuth/elevation] [-F[l|r]] [-G[d|f|n|l|L|x|X]<params>]
	[-K] [-L<Low/high>] [-M[<flag>]] [-O] [-P] [-Q<cut>] [-R<west>/<east>/<south>/<north>[r]] [-S<smooth>]
	[-T[+|-][<gap>[c|i|m|p]/<length>[c|i|m|p]][:LH]] [-U[/<dx>/<dy>][<label>]] [-V] [-W[+]<type><pen>]
	[-X[a|c|r]<x_shift>[u]] [-Y[a|c|r]<x_shift>[u]] [-Z[<fact>[/shift>]][p]] [-bo[s|S|d|D][<ncol>]] [-c<ncopies>]

	<grdfile> is 2-D netCDF grid file to be contoured
	-C Contours to be drawn can be specified in one of three ways:
	   1. Fixed contour interval
	   2. Name of file with contour levels in col 1 and C(ont) or A(nnot) in col 2
	      [and optionally an individual annotation angle in col 3.]
	   3. Name of cpt-file
	   If -T is used, only contours with upper case C or A is ticked
	     [cpt-file contours are set to C unless last column has flags; Use -A to force all to A]
	-J Selects map proJection. (<scale> in cm/degree, <width> in cm)

         :
         :
最低限必要なのは,
の 3つのようだ.-Cオプションの指定法は
の 3つがある.
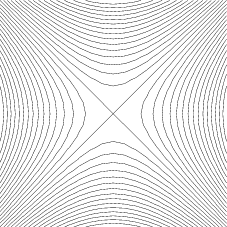
まずは,単純にコンター間隔を指定する 1. の方法で描画してみよう. grdファイルには,前回作った双曲放物面の hp.grd を使用する. コンター間隔は 1にしてみる.
$ grdcontour hp.grd -C1 -Jx1 > hp.eps

きれいなコンターが引けた.
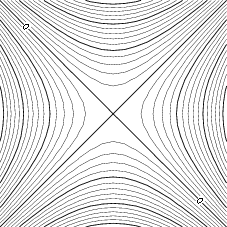
さらに -Aオプションで,数値付きの太線を引くことができる. 今回は 5 の倍数に太線を引いてみる.
$ grdcontour hp.grd -C1 -A5 -Jx1 > hp.eps

だいぶ,それっぽい図になってきた. 5本おきにコンターが太くなっているのがわかるだろうか(わかりにくいかな?). 数値は 0 のコンターにしか入っていないが, 図(の範囲)が大きくなれば,5,10,15 のコンターにも数値が入るはずである(たぶん).
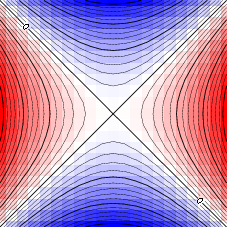
最後に,前回のグラデーション図と重ねてみる.
$ grdimage hp.grd -Ccp2.cpt -Jx1 -K >  hp.eps
$ grdcontour hp.grd -C1 -A5 -J   -O >> hp.eps

グラデーションとコンターを重ねることで, 双曲放物面の形状が,よりわかりやすくなったのではないだろうか.
[ KDOホームにもどる ] [ いちからはじめる GMT インデックスにもどる ]
(C) 2009 KDO