2009年 7月 1日 掲載
今回は,nearneighbor とならぶグリッドデータ作成コマンド surface を紹介するが….
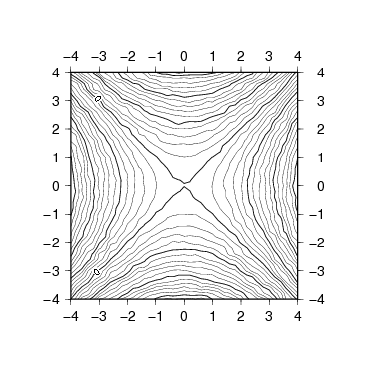
前回,nearneighborコマンドを用いてグリッド補完を行い, grdimage でグラデーション図を作って,きれいな図ができたと書いたが, 実はコンター図を作るとそんなにきれいでもない.
$ awk 'BEGIN{for(i=0; i<=2500; i++){x=rand()*10-5; y=rand()*10-5; print x, y, (x^2-y^2)}}' > hpr.txt
$ nearneighbor hpr.txt -Ghpr2.grd -I0.2 -R-4/4/-4/4 -S1.0
$ grdcontour hpr2.grd -Jx1 -C1 -A5 -Ba1 > hpr.eps

ガタガタである. nearneighborコマンドは,グリッド点に一番近いデータを補完に使うのだが, となり合うグリッドで,補完に使われるデータがちがうという場所で,不連続が生じてしまうのだ.
GMT には,nearneighbor のほかに,surface という,なめらかな grdファイルを作成するコマンドがある. どういうことをするのか man を読んでみよう. surface の man の 1行目には次のように書いてある.
surface - adjustable tension continuous curvature surface gridding algorithm
何のことかわからない….本文を読んでみよう.
surface reads  randomly-spaced (x,y,z) triples from standard input [or
xyz_file] and produces a binary grid file of gridded  values  z(x,y)  by
solving:

    (1 - T) * L (L (z)) + T * L (z) = 0

where T is a tension factor between 0 and 1, and L indicates the Lapla-
cian operator.  T = 0 gives the "minimum curvature" solution  which  is
equivalent  to  SuperMISP  and the ISM packages.  Minimum curvature can
cause undesired oscillations and false  local  maxima  or  minima  (See
Smith  and  Wessel,  1990),  and  you may wish to use T > 0 to suppress
these effects.  Experience suggests T ~ 0.25  usually  looks  good  for
potential field data and T should be larger (T ~ 0.35) for steep topog-
raphy data.  T = 1 gives a harmonic surface (no maxima  or  minima  are
possible  except  at  control data points).
ええと…,さっぱりわからない…. わからないなりに使ってみよう. surfaceコマンドを単独で実行して,ずらっと出てくる usage を読んでみる.
$ surface
surface 4.2.1 - Adjustable tension continuous curvature surface gridding

usage: surface [xyz-file] -G<output_grdfile_name> -I<xinc>[u][=|+][/<yinc>[u][=|+]]
	-R<west>/<east>/<south>/<north>[r] [-A<aspect_ratio>] [-C<convergence_limit>] [-H[i][<nrec>]]
	[-Ll<limit>] [-Lu<limit>] [-N<n_iterations>] ] [-S<search_radius>[m|c]] [-T<tension>[i][b]]
	[-Q] [-V[l]] [-Z<over_relaxation_parameter>] [-:[i|o]] [-bi[s|S|d|D][<ncol>]] [-f[i|o]<colinfo>]

	surface will read from standard input or a single <xyz-file>.

	Required arguments to surface:
	-G sets output grid file name
	-I<xinc>[m|c|e|k|i|n|+][=][/<yinc>[m|c|e|k|i|n|+][=]]
	   Give increment and append unit (m)inute, se(c)ond, m(e)ter, (k)ilometer, m(i)les, (n)autical miles.
	   (Note: m,c,e,k,i,n only apply to geographic regions specified in degrees)
	   Append = to adjust the domain to fit the increment [Default adjusts increment to fit domain].
	   Alternatively, specify number of nodes by appending +. Then, the increments are calculated
	   from the given domain and grid-registration settings (see Appendix B for details).
	-R specifies the min/max coordinates of data region in user units.
	   Use dd:mm[:ss] format for regions given in degrees and minutes [and seconds].
	   Use [yyy[-mm[-dd]]]T[hh[:mm[:ss[.xxx]]]] format for time axes.
	   Append r if -R specifies the longitudes/latitudes of the lower left
	   and upper right corners of a rectangular area.
	   -Rg -Rd are accepted shorthands for -R0/360/-90/90 -R-180/180/-90/90

	OPTIONS:
           :
           :
最低限,-Gオプションで grdファイル名,-Iオプションでグリッド間隔, -Rオプションで範囲を指定すれば, 「adjustable tension continuous curvature surface gridding」 してくれるようである.では,さっそく,
$ surface hpr.txt -Ghpr3.grd -I0.2 -R-4/4/-4/4
$ grdcontour hpr3.grd -Jx1 -C1 -A5 -Ba1 > hpr2.eps
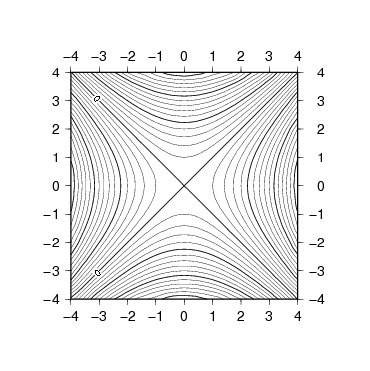
とりあえず,きれいなコンター図ができた.
man の解説によると,tension factor T という値を変えることによって, 出来上がりがずいぶん違うようだ. T=0 で最小曲率解?,T=1 で調和表面?だそうだが,何のことやら…. 経験的に,ポテンシャル場には T〜0.25 を使うことを, 勾配の急な地形データには T〜0.35 を使うことをすすめる, と書いてあるらしい(英語が苦手なので,間違っているかもしれない).
式を見せられても,解説を読んでも,何のことかさっぱりわからないので, 実際に T を変えて作ったデータを描画して,違いを見てみることにする. T の指定は -Tオプションで行う.デフォルトでは T=0.
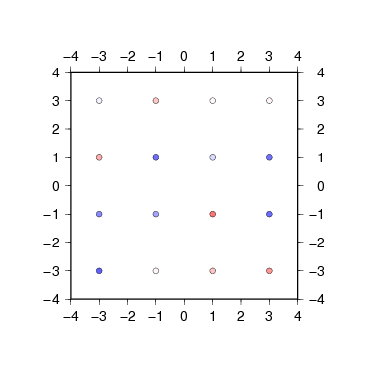
まずは,元データ作り.粗なデータセットを乱数で作る.
$ awk 'BEGIN{for(x=-3; x<=3; x+=2)for(y=-3; y<=3; y+=2)print x, y, rand()*20-10}' > rand.txt
できたデータをプロットしてみる.
$ echo -16 0 0 255 0 255 255 255 > cp2.cpt
$ echo 0 255 255 255 16 255 0 0 >> cp2.cpt
$ psxy rand.txt -R-4/4/-4/4 -Jx1 -Ba1 -Sc0.2 -Ccp2.cpt -W > rand.eps
これを nearneighbor で補完するとこうなる.
$ nearneighbor rand.txt -Grandnn.grd -I0.2 -R-4/4/-4/4 -S3.0
$ grdimage randnn.grd -Jx1 -Ccp2.cpt -Ba1 -K > randnn.eps
$ grdcontour randnn.grd -J -C1 -A5 -O >> randnn.eps
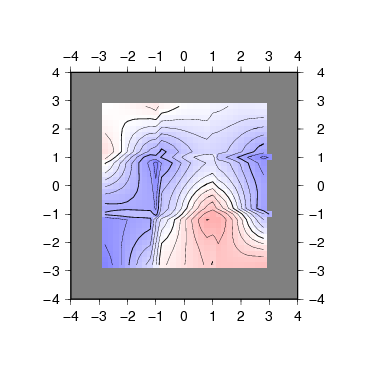
この図を基準にして,surface でできたグリッドデータを見てみよう.
まずは,tension factor T=0 の場合.
$ surface rand.txt -Granda.grd -I0.2 -R-4/4/-4/4
$ grdimage randa.grd -Jx1 -Ccp2.cpt -Ba1 -K > randa.eps
$ grdcontour randa.grd -J -C1 -A5 -O >> randa.eps
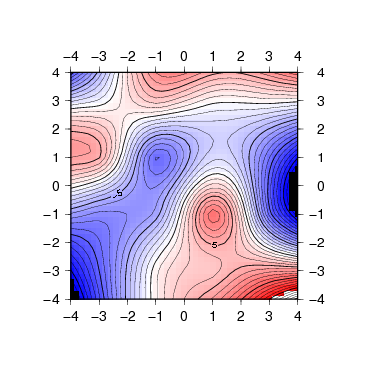
nearneighbor はデータに囲まれた領域の内挿しかしなかったが, surface は外挿もするようだ.
次に,おすすめの T=0.25 の場合.
$ surface rand.txt -Grandb.grd -I0.2 -R-4/4/-4/4 -T0.25
$ grdimage randb.grd -Jx1 -Ccp2.cpt -Ba1 -K > randb.eps
$ grdcontour randb.grd -J -C1 -A5 -O >> randb.eps
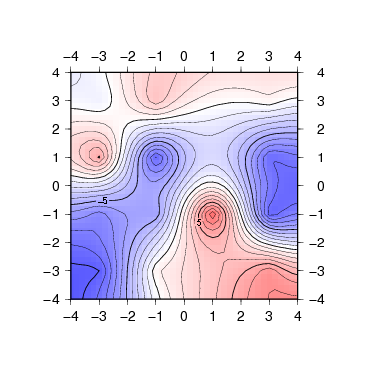
最後に,T=1.0 の場合を見てみる.
$ surface rand.txt -Grandc.grd -I0.2 -R-4/4/-4/4 -T1.0
$ grdimage randc.grd -Jx1 -Ccp2.cpt -Ba1 -K > randc.eps
$ grdcontour randc.grd -J -C1 -A5 -O >> randc.eps
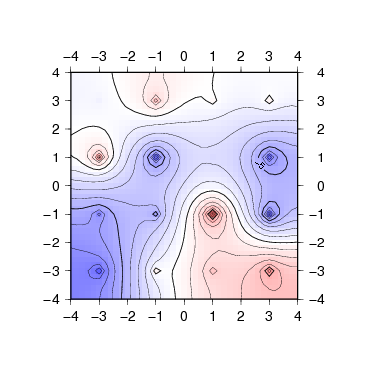
このケースでは,T=1.0 はとがりすぎで論外である. T=0.0 はなめらかだけど,大げさすぎかな? 最適な T は,いろいろ試して決めるのがよいようである.
ちなみに,筆者は surface をあまり使わない. 結果はきれいだけど,よくわからないものを使うのはどうも…. ふだんは,もっぱら nearneighbor を使い, コンター図がガタガタになって困るときだけ使っている.
[ KDOホームにもどる ] [ いちからはじめる GMT インデックスにもどる ]
(C) 2009 KDO