2009年 6月 1日 掲載, 2011年 1月 4日 修正(-Nオプションの説明)
今回は,きちんとグリッドに並んでいないデータから, 内挿計算によって grdファイルを作ってみる.
前回まで使ってきた双曲放物面データ hp.txt は計算して作ったので, データの座標がグリッド状で,xyz2grdコマンドで,そのまま grdファイルにしても問題なかった. しかし,あつかうデータが観測によるものなどの場合, データの座標がグリッドと一致していることはあまりないだろう. 今回はそういうケースをあつかってみる.
まずは例のデータ作りである. あつかうのは,前回と同じ双曲放物面で,やっぱり awk で作るのだが, 座標をランダムにしてある.
$ awk 'BEGIN{for(i=0; i<2500; i++){x=rand()*10-5; y=rand()*10-5; print x, y, (x^2-y^2)}}' > hpr.txt
データの個数は 2500個. 0.2間隔のグリッド点と同数にした((10/0.2)2).
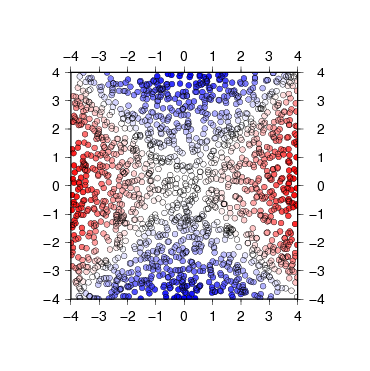
できあがったデータをプロットしてみよう. カラーパレットファイルには,その17 で作った cp2.cpt を使う.
$ psxy hpr.txt -R-4/4/-4/4 -Jx1 -Ba1 -Sc0.2 -Ccp2.cpt -K > hpr.eps
$ psxy hpr.txt -R -J -Sc0.2 -O >> hpr.eps

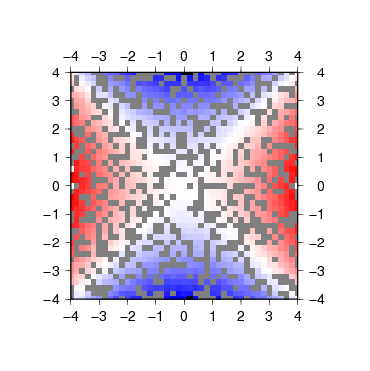
これを,そのまま xyz2grdコマンドで grdファイルにしてみると….
$ xyz2grd hpr.txt -Ghpr.grd -I0.2 -R-4/4/-4/4
$ grdimage hpr.grd -Jx1 -Ccp2.cpt -Ba1 > hpr.eps

予想通り穴だらけである.この穴を何らかの方法で補完したい.
GMT には nearneighbor という, Nearest neighbor法で内挿してグリッドデータを作るコマンドがある.
Nearest neighbor法がどういうアルゴリズムかは,man に説明がある.
nearneighbor reads  arbitrarily  located  (x,y,z[,w]) triples [quadru-
plets] from standard input [or xyzfile(s)] and uses a nearest  neighbor
algorithm to assign an average value to each node that have one or more
points within a radius centered on the node.  The average value is com-
puted  as  a weighted mean of the nearest point from each sector inside
the search radius.  The weighting function used is w(r) = 1 / (1 + d  ^
2),  where  d  = 3 * r / search_radius and r is distance from the node.
This weight is modulated by the observation points'  weights  [if  sup-
plied].
求めたいグリッド座標から,各セクタの一番近いデータを使い, 距離 r から計算した重み係数 w(r) = 1 / (1 + d2) (ここで d = 3 * r / S,S は探索半径)で重み付き平均を行うのである.
さっそく使ってみよう. まずは,例によってコマンドを単独で実行して,usage を見てみる.
$ nearneighbor
nearneighbor 4.2.1 - A "Nearest neighbor" gridding algorithm

usage: nearneighbor [xyzfile(s)] -G<out_grdfile> -I<xinc>[u][=|+][/<yinc>[u][=|+]]
	-N<sectors>[/<min_sectors>] -R<west>/<east>/<south>/<north>[r] -S<radius>[m|c|k|K] [-E<empty>] [-F]
	[-H[i][<nrec>]] [-L<flags>] [-V ] [-W] [-:[i|o]] [-bi[s|S|d|D][<ncol>]] [-f[i|o]<colinfo>]

	-G name of output grid.
	-I<xinc>[m|c|e|k|i|n|+][=][/<yinc>[m|c|e|k|i|n|+][=]]
	   Give increment and append unit (m)inute, se(c)ond, m(e)ter, (k)ilometer, m(i)les, (n)autical miles.
	   (Note: m,c,e,k,i,n only apply to geographic regions specified in degrees)
	   Append = to adjust the domain to fit the increment [Default adjusts increment to fit domain].
	   Alternatively, specify number of nodes by appending +. Then, the increments are calculated
	   from the given domain and grid-registration settings (see Appendix B for details).
	-N sets number of sectors and minimum number to be filled.
	   Default is quadrant search [4], requiring all to be filled.
	-R specifies the min/max coordinates of data region in user units.
	   Use dd:mm[:ss] format for regions given in degrees and minutes [and seconds].
	   Use [yyy[-mm[-dd]]]T[hh[:mm[:ss[.xxx]]]] format for time axes.
	   Append r if -R specifies the longitudes/latitudes of the lower left
	   and upper right corners of a rectangular area.
	   -Rg -Rd are accepted shorthands for -R0/360/-90/90 -R-180/180/-90/90
	-S sets search radius in -R, -I units; append m or c for minutes or seconds.
	   Append k for km (implies -R,-I in degrees), use flat Earth approximation.
	   Append K for km (implies -R,-I in degrees), use exact geodesic distances.
	   If the current ELLIPSOID is Sphere then spherical great circle distances are used.

         :
         :
元のデータファイルを指定することと, grdファイル名を指定する -Gオプション,グリッド間隔を指定する -Iオプション, 範囲を指定する -Rオプションは,xyz2grdコマンドと同じである. nearneighborコマンドでは,さらに探索半径を指定する -Sオプションが必要となる (データを探索するセクタ数を指定する -Nオプションも必須とあるが, なければデフォルト値 4(quadrant search)が入るので,省略してもいい).
では,実際に計算をして grdファイルを作ってみる.
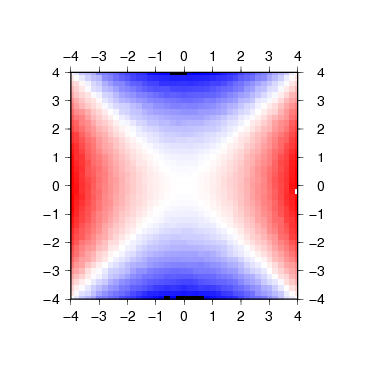
$ nearneighbor hpr.txt -Ghpr2.grd -I0.2 -R-4/4/-4/4 -S1.0
元データ hpr.txtから, 探索範囲 1.0 で Nearest neighbor法の内挿を行い, グリッド間隔 0.2 の grdファイル hpr2.grd を作成した.
これを図化してみよう.
$ grdimage hpr2.grd -Jx1 -Ccp2.cpt -Ba1 > hpr2.eps

きれいな図ができた.
[ KDOホームにもどる ] [ いちからはじめる GMT インデックスにもどる ]
(C) 2009 KDO