2009年 9月 1日 掲載
カラーパレットを出力する makecpt の 2回目である.
前回は地形図用のカラーパレットをためしたが, 今回はそれ以外のカラーパレットをためしたみる.
もう一度,makecptコマンドを単独で実行し,usage のパレットリストを見てみよう.
$ makecpt
makecpt 4.2.1 - Make GMT color palette tables

usage:  makecpt [-C<table>] [-D] [-I] [-M] [-N] [-Q[i|o]] [-T<z0/z1/dz> | -T<file>] [-V] [-Z]

	OPTIONS:
	-C Specify a colortable [Default is rainbow]:
	   [Default min/max values for -T are given in brackets]
	   ---------------------------------
	   cool      : Linear change from blue to magenta [0/1]
	   copper    : Dark to light copper brown [0/1]
	   cyclic    : Cyclic colormap, spans 360 degrees of hue [0/360]
	   gebco     : Colors for GEBCO bathymetric charts [-7000/0]
	   globe     : Colors for global bathy-topo relief [-10000/10000]
	   drywet    : Goes from dry to wet colors [0/12]
	   gray      : Grayramp from black to white [0/1]
	   haxby     : Bill Haxby's colortable for geoid & gravity [0/32]
	   hot       : Black through red and yellow to white [0/1]
	   jet       : Dark to light blue, white, yellow and red [0/1]
	   no_green  : For those who hate green [-32/+32]
	   ocean     : white-green-blue bathymetry scale [-8000/0]
	   panoply   : Default colormap of Panoply [0/16]
	   polar     : Blue via white to red [-1/+1]
	   rainbow   : Rainbow colors: magenta-blue-cyan-green-yellow-red [0/300]
	   red2green : Polar scale from red to green via white [-1/+1]
	   relief    : Wessel/Martinez colortable for bathymetry/topography [-8000/+8000]
	   topo      : Sandwell-Anderson colors for topography [-7000/+7000]
	   sealand   : Smith bathymetry/topography scale [-6000/+3000]
	   seis      : R-O-Y-G-B seismic tomography colors [-1/+1]
	   split     : Polar scale like polar, but via black instead of white [-1/+1]
	   wysiwyg   : 20 RGB colors for openwin -cubesize large and waxenvy printer [0/20]
	   ---------------------------------
           :
           :
           :
これを上から順にためしていく.
まずは,cool. パレットの範囲が 0〜1 なので, 以前に使ったガウス分布のデータが,描画をためすのにピッタリである.
$ awk 'BEGIN{for(x=-4;x<=4;x+=0.1)for(y=-4;y<=4;y+=0.1)print x, y, exp(-(x^2+y^2)/8)}' > g.txt
$ xyz2grd g.txt -Gg.grd -I0.1 -R-4/4/-4/4
$ makecpt -Ccool > cl.cpt
$ grdimage g.grd -Jx1 -Ccl.cpt -Ba1 > gauss_cl.eps

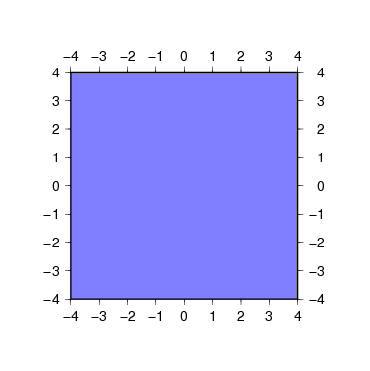
あれ?1色で平坦にぬりつぶされてしまった…. 何でだろう?と,カラーパレットファイル cl.cpt をたしかめてみると….
$ cat cl.cpt
#	cpt file created by: makecpt -Ccool
#COLOR_MODEL = RGB
#
0	128	127	255	1	128	127	255
B	0	0	0
F	255	255	255
N	128	128	128
0 から 1 までの 1色しか色の指定がない. これは,makecpt がデフォルトでは段彩のカラーパレットを出力するからで, 色指定が 1段階しかない cool では,1色しかないカラーパレットになってしまうのである. 連続的に色が変化するカラーパレットを作るには,-Zオプションをつける必要がある.
$ makecpt -Ccool -Z
#	cpt file created by: makecpt -Ccool -Z
#COLOR_MODEL = RGB
#
0	0	255	255	1	255	0	255
B	0	0	0
F	255	255	255
N	128	128	128
0 から 1 まで, シアン(0/255/255)からマゼンタ(255/0/255)に変化するカラーパレットが出力された. これをファイルに保存して,ガウス分布の図を描きなおしてみる.
$ makecpt -Ccool -Z > cl2.cpt
$ grdimage g.grd -Jx1 -Ccl2.cpt -Ba1 > gauss_cl2.eps
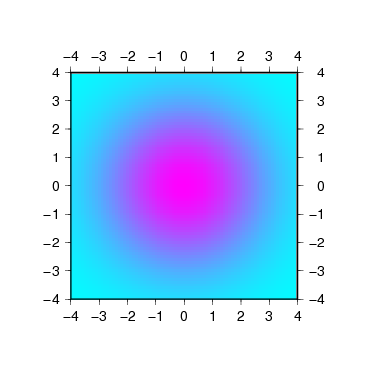
ちゃんと山ができた.
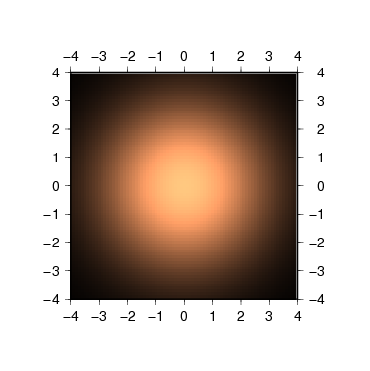
この調子でいこう.次は copper. 暗い銅色から明るい銅色までのカラーパレットである.
$ makecpt -Ccopper -Z > cp.cpt
$ grdimage g.grd -Jx1 -Ccp.cpt -Ba1 > gauss_cp.eps
次は,cyclic. 0度から 360度までの範囲をサイクリックに塗るカラーパレットである.
$ makecpt -Ccyclic -Z
#	cpt file created by: makecpt -Ccyclic -Z
#COLOR_MODEL = +HSV
#
0	0	1	1	180	180	1	1
180	180	1	1	360	360	1	1
B	0	0	1
F	0	0	0
N	0	0	0.74902
カラーパレットを見てみると,配色が RGB ではない. COLOR_MODEL が +HSV となっており,HSV色空間で表現されている. カラーパレットの配色は, 色相 H(Hue),彩度 S(Saturation),明度 V(Value)の値で指定されている. cyclic のカラーパレットでは,彩度 S,明度 V を最大値の 1 に固定して, 色相 H を 0〜360 まで変化させている.
このカラーパレットがどのように描画されるか見るために, 角度を z の値にもつデータファイル cyclic.txt を新しく作る.
$ awk 'BEGIN{for(x=-4;x<=4;x+=0.1)for(y=-4;y<=4;y+=0.1){z=atan2(y,x)*180/3.1415;if(z<0){z+=360};print x,y,z}}' > cyclic.txt
これを,カラーパレット cyclic で描画してみる.
$ xyz2grd cyclic.txt -Gcyclic.grd -I0.1 -R-4/4/-4/4
$ makecpt -Ccyclic -Z > cc.cpt
$ grdimage cyclic.grd -Jx1 -Ccc.cpt -Ba1 > cyclic.eps
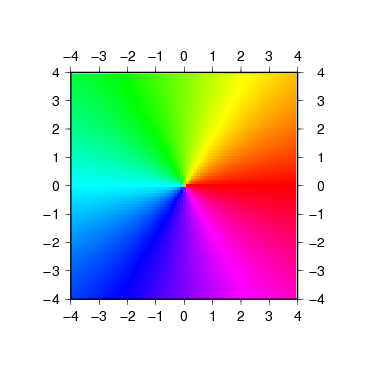
0度(x方向)から反時計回りに RGB と色が変化していき,360度で 0度に連続しているのがわかる.
次は drywet でガウス分布を描いてみる.
$ makecpt -Cdrywet -Z > dw.cpt
$ grdimage g.grd -Jx1 -Cdw.cpt -Ba1 > gauss_dw.eps
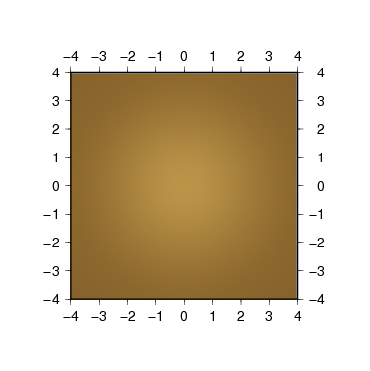
おっと,drywet のパレットの範囲は 0〜12 だったのをわすれていた. ガウス分布のデータの値は 0〜1 なので, のっぺりした図になってしまった. こういうときは,データに 12 をかける, のではなくて,makecpt の -Tオプションで, カラーパレットの範囲を変更する. -Tオプションには,
を指定する必要がある. ガウス分布の例では,z0=0,z1=1 はすぐ決まる. dz は,元のカラーパレットより細かい段階になるように決めておけばよいだろう. drywet のカラーパレットはデフォルトでは 6段階になっている.
$ makecpt -Tdrywet -Z
#	cpt file created by: makecpt -Cdrywet -Z
#COLOR_MODEL = RGB
#
0	134	97	42	2	238	199	100
2	238	199	100	4	180	238	135
4	180	238	135	6	50	238	235
6	50	238	235	8	12	120	238
8	12	120	238	10	38	1	183
10	38	1	183	12	8	51	113
B	0	0	0
F	255	255	255
N	128	128	128
今回は,8段階になるように,dz を 0.125 にしてみよう.
$ makecpt -Cdrywet -T0/1/0.125 -Z > dw2.cpt
$ grdimage g.grd -Jx1 -Cdw2.cpt -Ba1 > gauss_dw2.eps
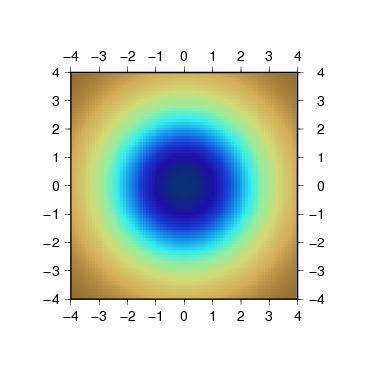
これは,0 がドライで茶色,1 がウエットで青色,という配色なのかな?
次,gray.
$ makecpt -Cgray -Z > gr.cpt
$ grdimage g.grd -Jx1 -Cgr.cpt -Ba1 > gauss_gr.eps
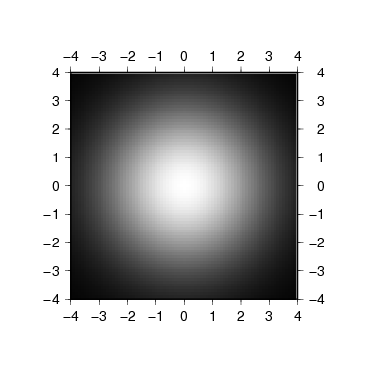
これは黒から白までのモノクロのグラデーションになる.
どんどん行こう.次,haxby. haxby のカラーパレットは 0〜32 の範囲を 32段階で色が指定されているので, -Tオプションは -T0/1/0.03125 としてみる.
$ makecpt -Chaxby -T0/1/0.03125 -Z > hx.cpt
makecpt: Warning: Making a continous cpt from a discrete cpt may give unexpected results!
警告が出てしまった. どうやら,haxby は離散的なカラーパレットで,-Zオプションとの相性がわるいらしい. なので,-Zオプションをはずしてやりなおし.
$ makecpt -Chaxby -T0/1/0.03125 > hx.cpt
$ grdimage g.grd -Jx1 -Chx.cpt -Ba1 > gauss_hx.eps
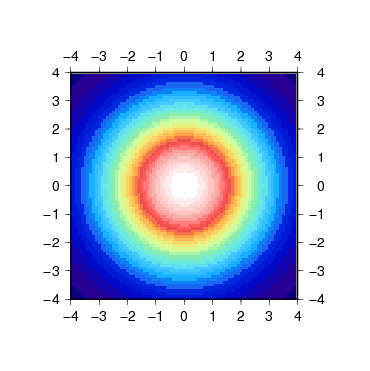
たしかに,離散的,かな?
次,hot.
$ makecpt -Chot -Z > ht.cpt
$ grdimage g.grd -Jx1 -Cht.cpt -Ba1 > gauss_ht.eps
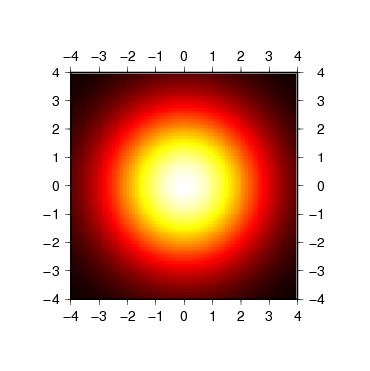
熱そうだ.
次,jet.
$ makecpt -Cjet -Z > jt.cpt
$ grdimage g.grd -Jx1 -Cjt.cpt -Ba1 > gauss_jt.eps
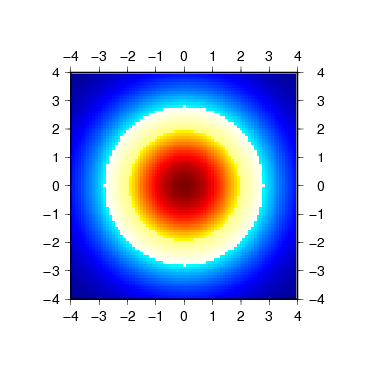
まぶしい.
8つのカラーパレットを紹介したところで,今回は終了. 残りの 8つは次回にまわすことにする.
[ KDOホームにもどる ] [ いちからはじめる GMT インデックスにもどる ]
(C) 2009 KDO