2012年 8月 1日 掲載
今回はちょっと毛色の変わったコマンド,pshistogram を紹介する.
pshistogram は,1次元のデータを解析してヒストグラムを描画するコマンドである.
まずは,解析に使うデータと用意しよう. その34 でも使った Box-Muller法で,5000個の正規乱数列を作成する.
$ awk 'BEGIN{for(i=0;i<2500;i++){x1=rand();x2=rand();if(x1!=0)print sqrt(-2*log(x1))*cos(2*3.1415*x2);print sqrt(-2*log(x1))*sin(2*3.1415*x2)}}' > rand.txt
で,できあがったデータ rand.txt を pshistogramコマンドに与えてみると,
$ pshistogram rand.txt > histogram.eps
pshistogram: GMT SYNTAX ERROR -W option:  bin width must be nonzero
pshistogram: Must specify either fill (-G) or lookup colors (-C), outline pen attributes (-L), or both.
エラーが 2つ出た.
1つ目のエラーには,度数の幅(bin width)を -Wオプションで指定せよ,とある.
2つ目のエラーは,塗りつぶすか(-G),色を変えるのか(-C),アウトラインのペンをどうするか(-L)を指定しなくてはならない,とのことである.
では,度数の幅は 0.2 に,グラフの描画はアウトラインで行うことにして,どういう図ができるかためしてみよう.
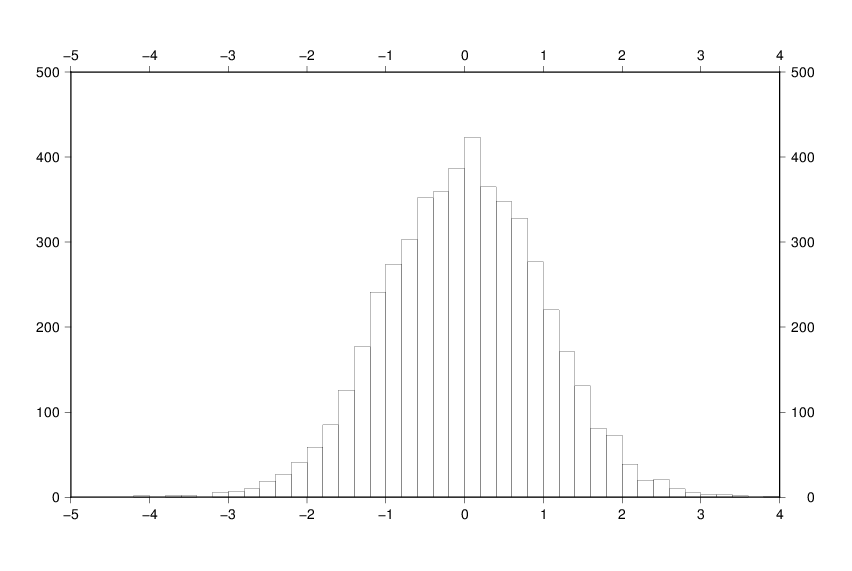
$ pshistogram rand.txt -W0.2 -L > histogram.eps

図の縮尺,描画範囲,目盛の間隔などは自動で決めてくれるようだ. それぞれ,どういう数値で描画されているかを知るためには,-Vオプションをつけて実行すればよい.
$ pshistogram rand.txt -W0.2 -L -V > histogram.eps
pshistogram: 5000 points read
pshistogram: WARNING: 5000 multiple modes found
pshistogram: Extreme values of the data :	-4.10239	3.854
pshistogram: Locations: L2, L1, LMS; Scales: L2, L1, LMS	-0.00255528063511	0.0103926	0.0965825	1.00158330536	1.01580398304	1.0048343739

pshistogram: min/max values are :	-4.10239	3.854	0	423
pshistogram: Use w/e/s/n = -5/4/0/500 and x-tick/y-tick = 1/100
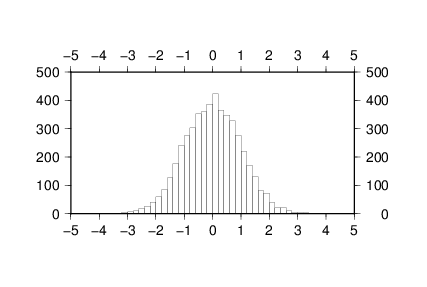
グラフの描画には,最後の 2行の情報が参考になる. min/max values の値を参考に,縮尺は -Jx1/0.01 とし, 範囲を 0 を中心に左右対称になるよう -R-5/5/0/500 にし, 目盛の間隔は,x-tick/y-tick の値をそのまま使って -Ba1/a100 としてみる.
$ pshistogram rand.txt -Jx1/0.01 -R-5/5/0/500 -Ba1/a100 -W0.2 -L > histogram.eps
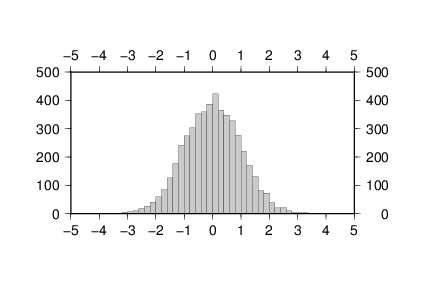
-Gオプションをためしてみよう.棒グラフを gray で塗りつぶしてみる.
$ pshistogram rand.txt -Jx1/0.01 -R-5/5/0/500 -Ba1/a100 -W0.2 -L -Ggray > histogram.eps
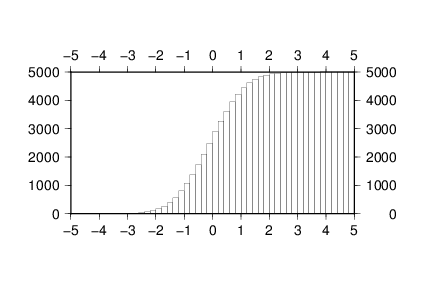
pshistogramコマンドでは,-Qオプションを使うと累積ヒストグラムが描画される. まずは,自動設定で描いてみよう.
$ pshistogram rand.txt -W0.2 -L -Q -V > histogram.eps
pshistogram: 5000 points read
pshistogram: WARNING: 5000 multiple modes found
pshistogram: Extreme values of the data :	-4.10239	3.854
pshistogram: Locations: L2, L1, LMS; Scales: L2, L1, LMS	-0.00255528063511	0.0103926	0.0965825	1.00158330536	1.01580398304	1.0048343739

pshistogram: min/max values are :	-4.10239	3.854	0	5000
pshistogram: Use w/e/s/n = -5/4/0/5000 and x-tick/y-tick = 1/1000
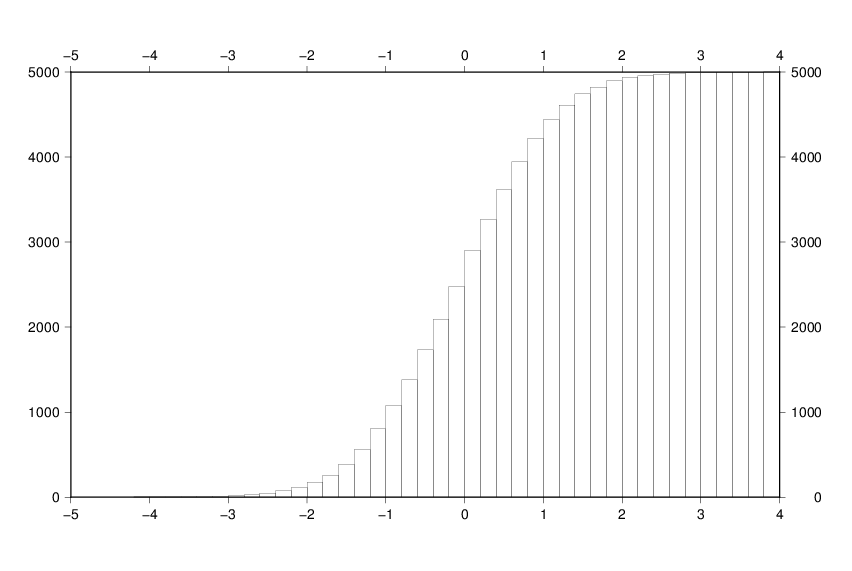
最終的には,-Vオプションの出力を参考に, -J,-R,-Bオプションの値を決めて,好みの図に仕上げよう.
$ pshistogram rand.txt -Jx1/0.001 -R-5/5/0/5000 -Ba1/a1000 -W0.2 -L -Q > histogram.eps
[ KDOホームにもどる] [ いちからはじめる GMT インデックスにもどる ]
(C) 2012 KDO